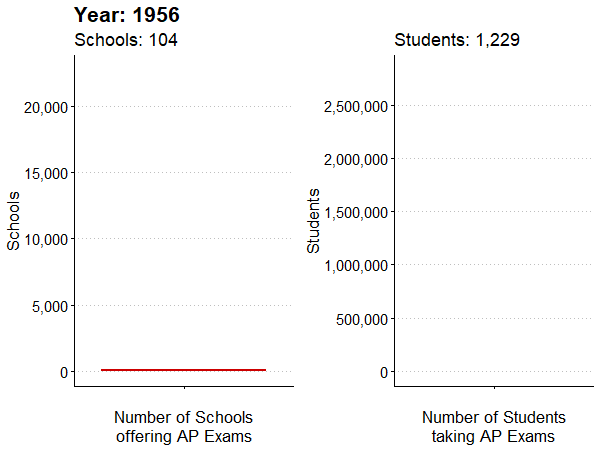
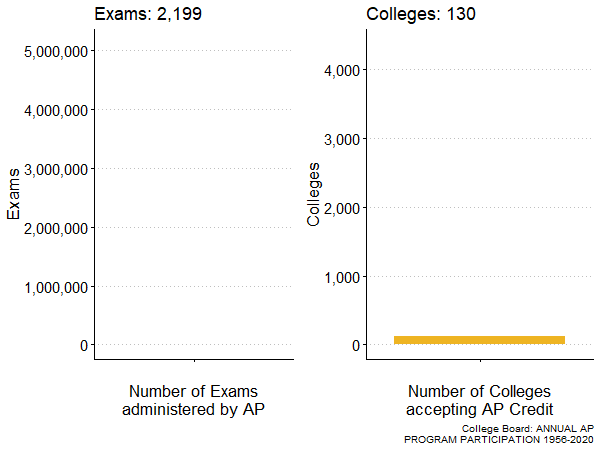
This page contains four graphs that show the annual AP program participation from 1956 to 2020. By looking at these graphs, we can tell that the growth rate is similar for the number of schools that offer AP exams and the number of colleges that accept AP credit. Similarly, we can tell that the growth rate is similar for the number of students taking AP exams and the number of exams administered by AP.